Selected study
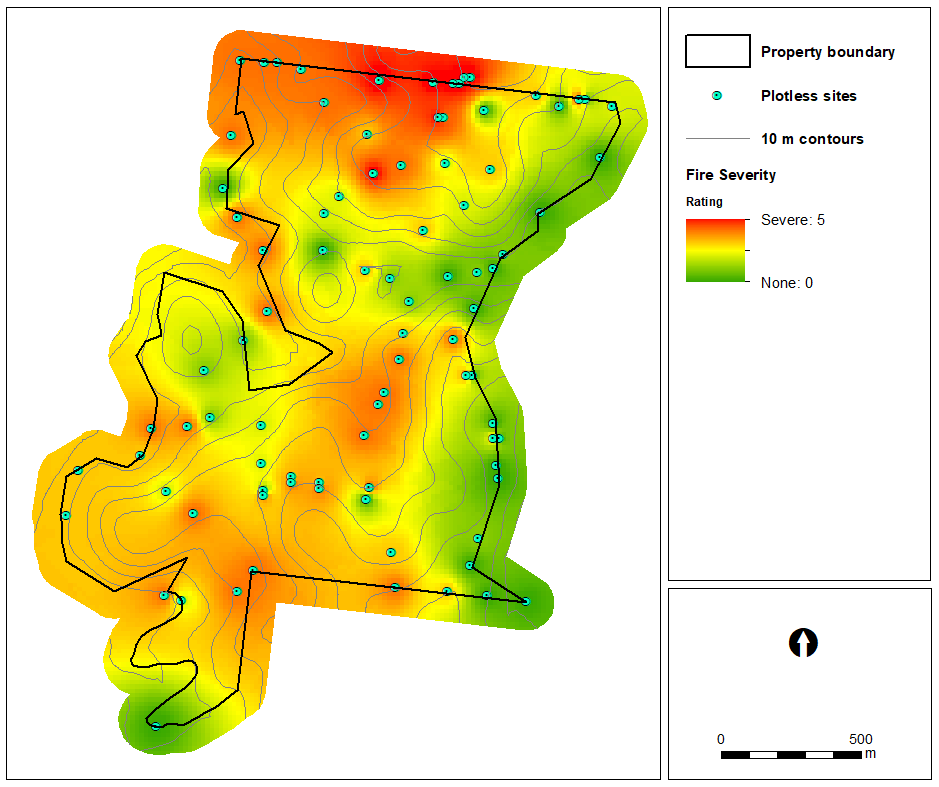
The following fire severity map is derived from site data from 88 locations within a research property. At each location, the fire severity is measured using the Geometrically Structured Composite Burn Index (GeoCBI), and the values are then used to create a "heat" map using spatial interpolation with Inverse Distance Weighting (IDW). The map is from a study of koala habitat responses to fire - https://doi.org/10.1016/j.foreco.2024.121704
The following fire severity map is derived from site data from 88 locations within a research property. At each location, the fire severity is measured using the Geometrically Structured Composite Burn Index (GeoCBI), and the values are then used to create a "heat" map using spatial interpolation with Inverse Distance Weighting (IDW). The map is from a study of koala habitat responses to fire - https://doi.org/10.1016/j.foreco.2024.121704
This map, and the values from it, are used to ground-truth (verify) and calibrate a Sentinel-2 satellite image with two of the bands from the sensors (near infrared and short wave infrared) processed using the Normalised Burn Ratio (NBR), to quantify the severity of burning within the study area, and the region surrounding it.
To monitor change in condition, available images are selected from two dates of capture - shortly before the fire, and soon after the fire, and the pixel values of the post-fire NBR are subtracted from the pre-fire NBR. This results in a differenced NBR (dNBR), where the higher calculated pixel values indicate higher fire severity. As indicated by the map, and the dNBR image it resembles, the central northern part of this property was severely burnt in the Black Summer fires of late 2019.
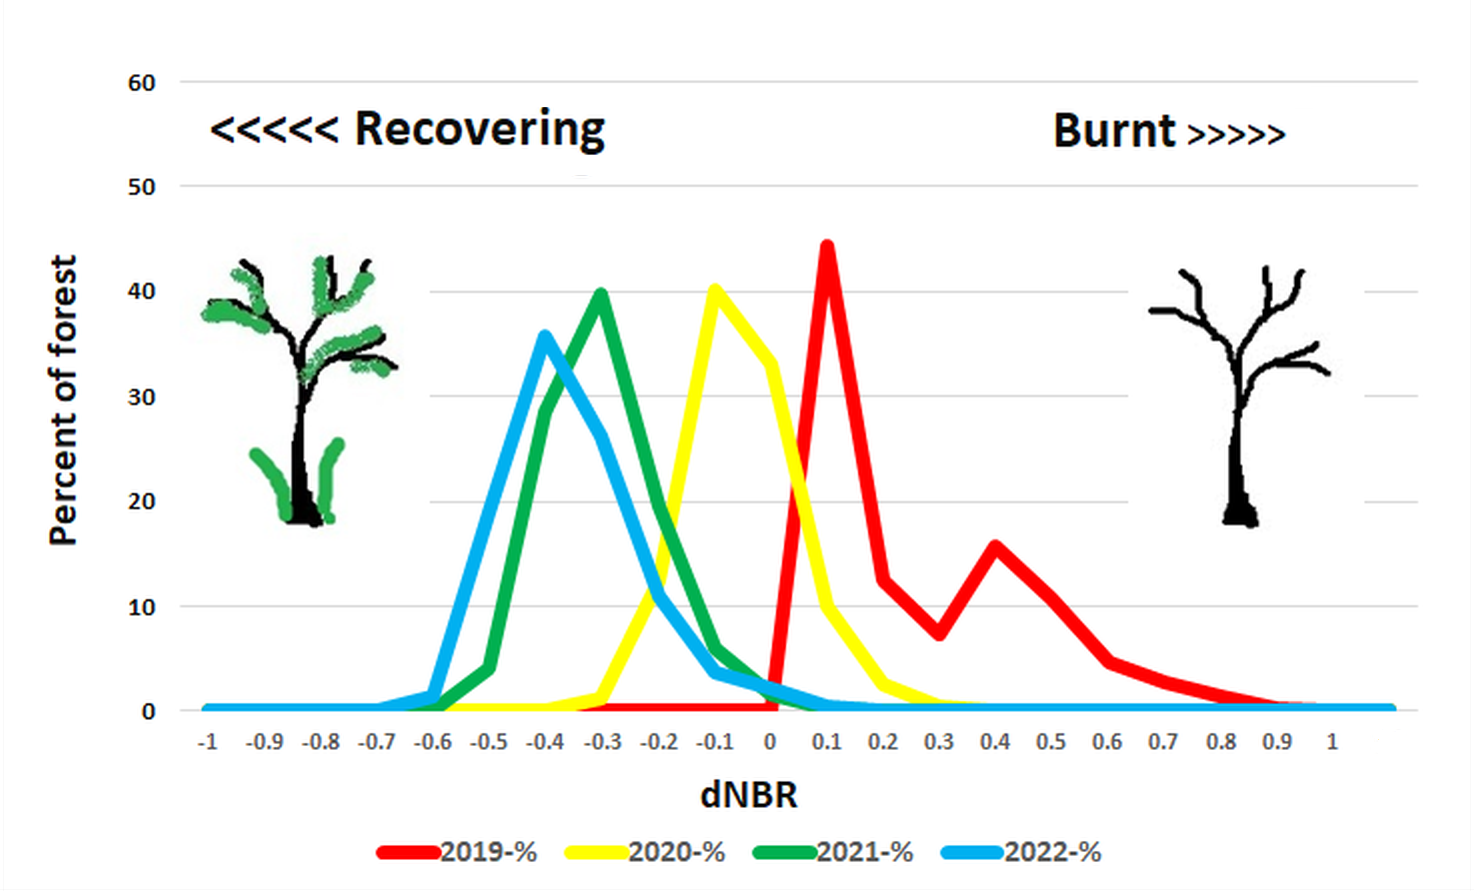
Then when applied at a regional scale of about 100km x 100km (the size of a single Sentinel-2 image), the following changes were observed over a four year period, as the region in general recovered from either fire or very dry conditions. The graph is from a regional extension of the koala habitat study - https://doi.org/10.3390/f15111991
To monitor change in condition, available images are selected from two dates of capture - shortly before the fire, and soon after the fire, and the pixel values of the post-fire NBR are subtracted from the pre-fire NBR. This results in a differenced NBR (dNBR), where the higher calculated pixel values indicate higher fire severity. As indicated by the map, and the dNBR image it resembles, the central northern part of this property was severely burnt in the Black Summer fires of late 2019.
Then when applied at a regional scale of about 100km x 100km (the size of a single Sentinel-2 image), the following changes were observed over a four year period, as the region in general recovered from either fire or very dry conditions. The graph is from a regional extension of the koala habitat study - https://doi.org/10.3390/f15111991
Applicability of remote sensed data
The NBR is a useful method for:
- fire
- drought
Instead of the NBR, a range of other calculations and processing can be done on remote-sensed imagery to provide insights into:
- habitat loss and recovery
- forest type (and some species composition)
- forest health
- crop health
- groundwater impacts
- flooding and flood risk
- sediment movement
- sediment plumes
- water weed and algal blooms
- glacial movement
- surface expression of geology
- emissions
The use of hyperspectral imagery provides an opportunity for improved differentiation and QTree is currently researching some of these possibilities.